
Gold has had a terrific run over the past month.
The precious metal is up $70 per ounce since mid-December. And if you’ve been following my advice here in Growth Stock Wire, you’ve had two chances to profit off of it.
[ad#Google Adsense 336×280-IA]I recommended buying gold [earlier this month] to take advantage of the seasonal strength that typically occurs between December 18 and January 6.
That trade was good for a gain of almost $50 per ounce.
Then, two weeks ago, after gold had pulled back and was testing the support of its moving average lines, I recommended buying it again because the technical condition looked bullish. Gold is up about $40 per ounce since that trade.
Now, it’s time to take profits…
To be clear, I’m not suggesting you should sell your longer-term gold holdings – the stuff you bought to protect yourself against a drop in the dollar, an economic collapse, or the end of the world as we know it.
I like gold for the long term. Heck, I like it for the intermediate term, too. I think it will end 2016 much higher than where it is right now. But for the short term, as a trader, it’s time to sell.
Take a look at this chart…
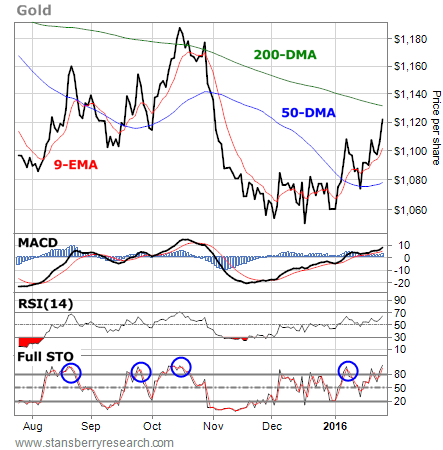
Gold is approaching its 200-day moving average (DMA), the green line on the chart. That’s a natural resistance level, and we shouldn’t expect the metal to rally above that resistance on the first attempt.
After this week’s solid move higher, gold is a bit overbought and extended above both its nine-day exponential moving average (EMA) – the red line – and its 50-DMA, the blue line. The action should be choppy for a bit up here and give the moving averages a chance to catch up to the price of gold. That would create a better-looking setup for gold to attempt to breakout above its 200-DMA a few weeks from now.
Gold is also getting overbought on a few of its technical indicators. For example, look at the stochastics indicator at the bottom of the chart. This is another way to measure overbought and oversold conditions. The stochastics indicator has rallied above 80, which means it’s overbought.
We’ve seen this condition four previous times over the past six months. Each time marked a short-term top in the price of gold. The metal reversed and fell back toward its 50-DMA (or lower).
Similar action this time would mean a drop of about $40 an ounce from Tuesday’s closing price. So if you bought gold two weeks ago based on my advice, you should consider taking profits as the metal approaches its 200-DMA.
We’ll look to get back into the trade on any move back down toward the 50-DMA over the next few weeks.
Best regards and good trading,
Jeff Clark
[ad#stansberry-ps]
Source: Daily Wealth
