
Yesterday, I shared one of my favorite chart setups for identifying quick trades that are set to bounce off the bottom – the “Bullish Falling Wedge.”
[ad#Google Adsense 336×280-IA]As I told readers, the bullish wedge is used for short-term trades only.
Today, we’ll look at my favorite bottoming pattern designed to generate longer-term investing ideas… the “Inverted Head and Shoulders” formation.
An inverted head and shoulders (H&S) pattern is a bullish formation.
It signals the reversal from an intermediate-term bearish trend to an intermediate-term bullish trend.
To show you how it works, let’s use the price of copper earlier this year as an example…
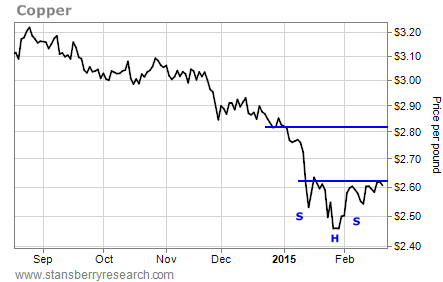
The price of copper peaked in 2011 at about $4.60 per pound. It has been in a bear market ever since. Earlier this year, though, the chart started to form an inverse H&S pattern.
The left shoulder of the pattern formed when copper hit a new low in early January at about $2.55 per pound and then bounced back up. Copper fell again and hit a lower low in late January at $2.45 per pound. But notice how the next rally DID NOT form a lower high. Instead, copper rallied right back up to its previous high – thereby establishing the “neckline,” or a clear resistance area of the pattern.
The right shoulder formed when copper fell again, but this time it created a higher low on the chart. Then it rallied once again toward the neckline.
This is what an inverse H&S pattern looks like. You can calculate the potential target of a breakout of the pattern by measuring the distance from the head ($2.45 per pound, in this case) to the neckline (which was at $2.63). That gives us a difference of $0.18 – or roughly a 7% move above the neckline.
So based on this pattern, we’d be looking for a move up to about $2.81 per pound ($2.63 + $0.18).
Here’s what happened…
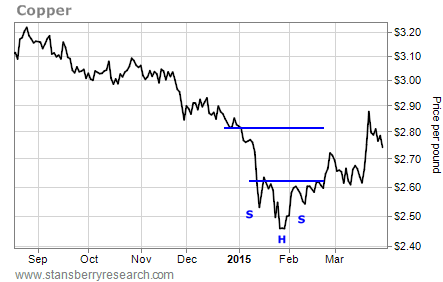 Copper broke out to the upside of the inverse H&S pattern. After the initial spike higher, copper came back down and retested the neckline level as support. Then it rallied and achieved the price target for the move in about one month.
The amount of time it takes to complete a targeted move for an inverse H&S pattern is often related to how long it took the pattern to develop in the first place. In this example with copper, it took about one month, from mid-January until mid-February, for the inverse H&S pattern to develop. It also took about one month from the time copper broke out of the pattern until it achieved its upper price target.
Here’s another good example, going back a few years, with retailer Nordstrom (JWN)…
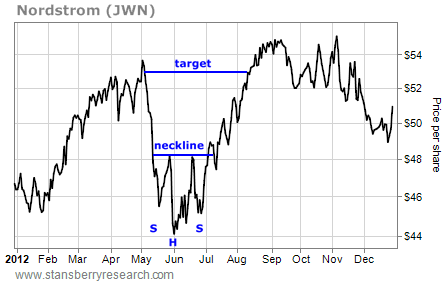
It took JWN almost two months to complete an inverted H&S pattern between May 2012 and June 2012. The distance between the head and the neckline measured at about $4.50. So when JWN rallied above $48.50 in early July and broke above the neckline, it gave us a price target of $53 per share ($48.50 + $4.50).
As you can see from the chart, JWN hit that price target in about seven weeks.
The traditional way to trade an inverse H&S pattern is to wait until a stock breaks above the neckline of the pattern and then buy it right away.
Aggressive traders can increase the potential gains on a trade, though, by buying the stock as soon as it appears the right shoulder has formed (by the stock making a higher low and then rallying off it).
Traders can then set a stop just below the “head” of the pattern and exit the trade for a relatively small loss if the pattern breaks down.
Keep an eye out for these patterns… The stock market is entering a correction phase and the inevitable bottoming process will follow. By recognizing these setups, you can position yourself to profit.
Best regards and good trading,
Jeff Clark
[ad#stansberry-ps]
Source: Growth Stock Wire
