
Gold stocks are on the verge of a big move.
The question is… Which way?
With the dollar breaking down… and with the monthly chart of gold recently triggering its first “buy” signal since 2009… the odds seem to favor a breakout to the upside.
But it really all depends on which way the chart breaks…
Take a look at the recent action in the benchmark Market Vectors Gold Miners Fund (GDX)…
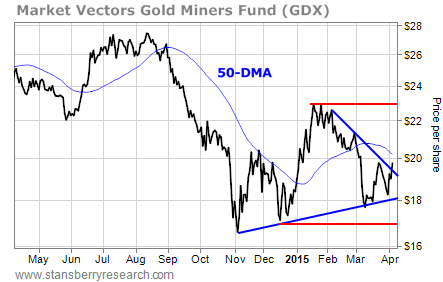
The blue lines on the chart show a consolidating-triangle pattern. This is a series of higher lows and lower highs that gives a stock a chance to build energy for its next trending move.
[ad#Google Adsense 336×280-IA]It appears that GDX is breaking the pattern to the upside.
If it closes above the March high of $19.82, it would kick off a bullish move that could rally back up to the January high near $23 per share.
Traders looking to get exposure to the sector should buy gold stocks if GDX closes above $19.82 per share.
But there are no guarantees…
We’ve had several bullish setups in the gold sector over the past few months.
Some have worked out well, like the rally that kicked off the New Year. Other potentially bullish setups have fizzled out – like the pattern we looked at in mid-February.
If GDX reverses from here and breaks the pattern to the downside, then it’s probably headed back toward the December low at about $17 per share.
Traders can look to short the sector on a breakdown below $18.
Right now, the setup is favoring a move to the upside. The weakness in the dollar and the recent strength in gold favor that move as well. But keep an eye on the chart… it’ll tell you which way gold stocks are likely to move.
Best regards and good trading,
Jeff Clark
[ad#stansberry-ps]
Source: Growth Stock Wire
