
Over the last two days, I’ve shown you how I gauge the health of the U.S. economy.
I’ve also shown you why you can’t blindly trust the government’s economic statistics. Not because of some conspiracy agenda… but because measuring a $17 trillion economy is extremely difficult.
So far, we’ve taken in-depth looks at gross domestic product (GDP) to see how the economy is really doing… and at the Consumer Price Index (CPI) to see if it’s telling the whole story on inflation.
[ad#Google Adsense 336×280-IA]Today, I’m going to cut through the political spin and share the facts on another controversial government statistic… unemployment.
It’s an unquestioned fact that initial jobless claims are way down.
Fewer people are losing their jobs and filing for unemployment benefits.
People are getting laid off at a rate that suggests normal economic activity – not a recession.
The official unemployment rate shows that we’re down to 5.5%.
So what about the claims that this is smoke and mirrors?
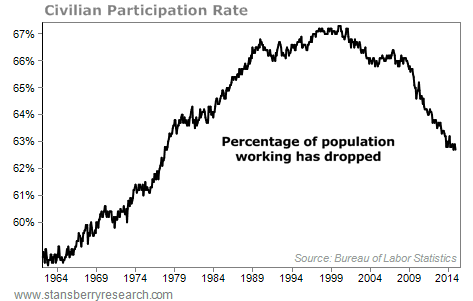
Naysayers will point to the labor participation rate… the pure percentage of the population (over 16 years old) that is working. It declined during the recession and some say that the unemployment rate is low only because people have given up looking for work.
 The truth is, this is derived from demographics.
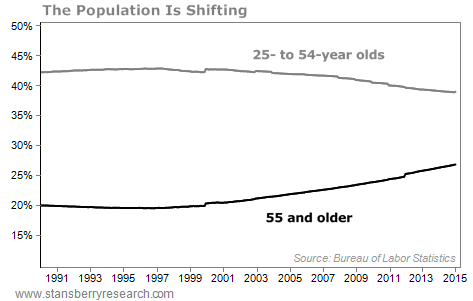
First, the labor participation rate for those 24 to 54 years old is 80.8%. It was at 83% before the recession. The participation rate for those older than 55 is only 39%.
That’s because as people age, they retire and drop out of the labor force.
And get this… in 2000, the 25-to-54-year-old group made up 42% of the population, while the 55-and-over group made up 20%.
Today, the over-55 group makes up 27%, while the younger group has declined to 39%.
The labor participation rate doesn’t show a weak economy. It doesn’t show a dishonest number. It shows that Baby Boomers are entering retirement.
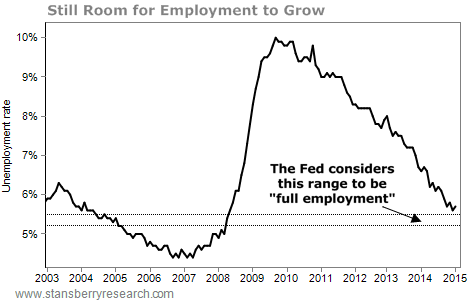
 And there’s room for employment to grow…
Yes, unemployment has improved from a peak of 9.9% in April 2010 down to 5.5% today. But that’s not really “low” unemployment. That’s about average. We’d have to get down to 5.2% to be at full employment, according to the Federal Reserve…
 I’m also seeing improvement in an anecdotal indicator I call the “cabbie index.”
There are few people more tuned into how the economy is doing than cab drivers, especially in New York. When the world is running on all cylinders, people take cabs in NYC. For instance, I spent a good amount of time in New York during the last three big investment bubbles: 1987, 2000, and 2007. During those peaks, it was nearly impossible to get a cab, even on a sunny day.
When I first wrote about the cabbie index in August 2009, there was a line of cabs just waiting for passengers outside New York City’s Penn Station that was longer than I’ve ever seen. The cab drivers I talked to were worried about being able to feed their families.
Today, I’ve expanded my cabbie index a bit…
Recently, I used an Uber driver instead of a cabbie. It was clear that business is good. The driver explained that he wanted more work and is now getting it… So much so that he is able to choose jobs instead of having to take each one that came his way.
Again, don’t blindly trust economic statistics. Measuring the economy is difficult business. But there’s no conspiracy agenda. You just have to dig a little deeper to get the full picture.
And as I’ve shown you over the last three essays, whether you look at the government data – or experience it for yourself – there’s no question the economy is improving.
Here’s to our health, wealth, and a great retirement,
Dr. David Eifrig
[ad#stansberry-ps]
Source: Daily Wealth
