
It’s rally time…
Stocks exploded higher on Wednesday following the Federal Open Market Committee (FOMC) announcement on interest rates.
The Fed didn’t say anything surprising. It eliminated the word “patient” from its statement, and it talked about “moderating economic activity.” The Fed also announced it was unlikely to raise interest rates in April.
[ad#Google Adsense 336×280-IA]Most analysts cited the Fed’s “dovishness” toward interest rates as the reason the stock market rallied.
But there’s more to it than that…
As I wrote last week, the stock market was primed for an explosive rally.
The S&P 500 was oversold.
Technical indicators like the NYSE McClellan Oscillator (the “NYMO”) were at levels that often precede rallies.
And we’ve entered one of the strongest seasonal periods for stock prices.
Everything was lining up for an upside blast. The Fed merely lit the match.
So now, with the S&P 500 more than 2% higher than where it closed last Wednesday, the obvious is question is… How much higher can stocks go?
To answer that, let’s take an updated look at the chart of the S&P 500…
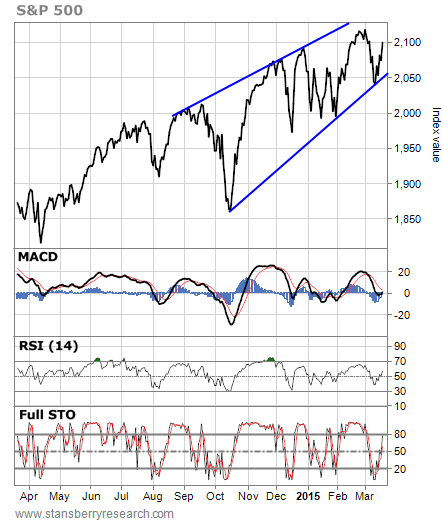 After testing the support line of the rising-wedge pattern last week, the S&P 500 has put on a solid bounce and has moved sharply higher.
There is some resistance at the 2,119 level – which is the spot of the all-time high. But all three of the momentum indicators at the bottom of the chart (the Moving Average Convergence Divergence, Relative Strength Index, and Stochastics) are in “neutral” territory. They’re not even close to being overbought yet. There’s plenty of room for those indicators to work higher.
Now take a look at this updated chart of the NYMO…
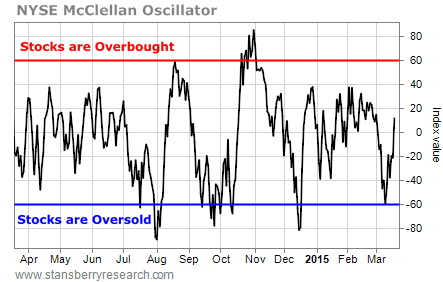 Remember, a reading of more than 60 on the NYMO points to overbought conditions and often marks the end of a rally in the market. A reading of less than -60 points to oversold conditions and often marks the end of a downtrend in the market.
You can see that the NYMO bounced off extremely oversold conditions last week. But it’s still just above the neutral reading of zero. And just like the momentum indicators for the S&P 500, the NYMO is nowhere near overbought levels.
So even though stocks enjoyed a big run higher over the past week, there are bigger gains ahead.
The S&P 500 is likely to take out resistance at 2,119 and head toward the resistance line of the rising-channel pattern at about 2,135 or so. At that point, traders should probably think about taking some profits off the table – especially if the technical indicators stretch into the overbought zone.
But for now, the trend is higher. If you bought stocks last week, hang on. There’s more room left in the rally.
If you didn’t buy last week, then take advantage of any quick declines to add some long-side exposure. The bulls should have the momentum between now and the end of April.
Best regards and good trading,
Jeff Clark
[ad#stansberry-ps]
Source: Growth Stock Wire
