
One of America’s most accurate stock market gurus is wary right now.
James Stack is a successful investment manager. He has predicted several of the past big tops in the stock market – including the 1987 market crash and the 2007-2009 bear market.
And like Stansberry Research founder Porter Stansberry, Stack believes we’re nearing a top in the market again today.
That doesn’t mean it’s time to run for the exits. But I’ll show you why you should be cautious…
[ad#Google Adsense 336×280-IA][Two weeks ago], I saw Stack speak at the World MoneyShow Orlando, which is one of the largest investment conferences in the U.S.
Stack is a regular speaker at the conference.
And he said one of the main things that has changed since last year is the big drop in oil prices.
The benchmark West Texas Intermediate (WTI) crude oil price has fallen in half since mid-June.
In an economic sense, this has made consumers happier than they’ve been in a long time.
Low prices at the pump give consumers more cash to spend. And they’ve used some of that extra cash to help drive stock prices to near-record levels.
But stocks can’t go up in a straight line forever. Eventually, the market WILL crash. It’s just a matter of when. Stack says we’re in the latter third of this bull market. He expects a bear market to develop over the next 18 months.
So is it time to get out of stocks? Not yet…
As Stack said in Orlando, “you’re not trying to be the first cow out of the barn if it catches on fire… but you don’t want to be the last.”
In short, you don’t need to get all your money out of the market today. You just need to be cautious. And Stack says there are four indicators that will warn us if the bull market is rolling over.
The first is the Conference Board Leading Economic Index (the “LEI”). The LEI attempts to predict the future state of the economy by reviewing 10 economic releases, including the number of new building permits, the S&P 500’s performance, the money supply, and interest-rate spreads.
This index tends to rally in advance of economic strength and decline ahead of downturns. As you can see in the chart below, the LEI peaked at around 125 in 2006 – warning of a coming recession. In late 2007, the recession hit and stocks fell 57% from their October 2007 top to their March 2009 bottom.
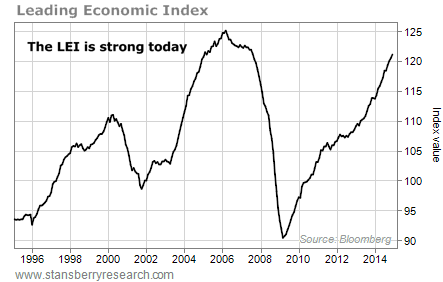 The LEI bottomed in 2009 ahead of the recovery and has been moving higher ever since. Today, it’s close to its highest-ever level, and it shows no signs of peaking.
So the LEI isn’t warning of an economic downturn yet.
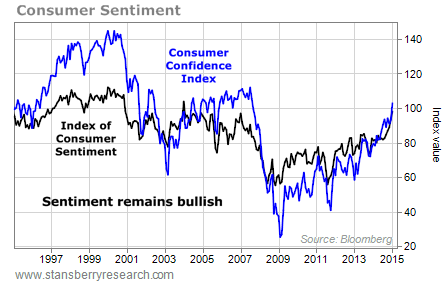
The next indicator to gauge where the market is headed is consumer sentiment. Consumer sentiment measures how consumers feel about the economy. When consumer sentiment is rising, investors are confident about the economy and more likely to invest in the market. But when sentiment starts to fall, investors are nervous and are more likely to get out of the stock market.
You can track consumer sentiment through the Conference Board Consumer Confidence Index and the University of Michigan’s Index of Consumer Sentiment. Both of these indexes move in similar patterns.
As you can see, both of these indexes peaked around early 2007 – and then plunged as the global recession hit and the market crashed.
But today, the Consumer Confidence Index is at a seven-year high, while the Index of Consumer Sentiment is at a 10-year high. We haven’t seen any signs of peaking yet, so both of these indexes remain bullish for the market.
 So two of Stack’s indicators say the bull market is still going.
But two others are flashing warning signs…
Stack’s third way to tell where the market is headed next is the 30-year Treasury bond yield.
Treasury yields move opposite of bond prices, so falling yields mean bond prices are moving higher. An increase in Treasury yields from their all-time lows could signal nervousness in the market. This would be bearish.
We saw our lowest month-end Treasury yield at the end of January.
But as you can see in the chart below, the yield has since ticked higher… from 2.22% to 2.58%.
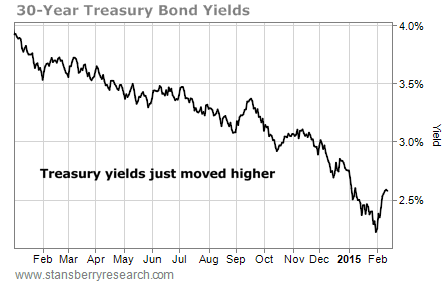 As Jeff Clark mentioned in Growth Stock Wire, the recent spike in Treasury yields is a bearish sign.
But there’s one more… The margin debt on the New York Stock Exchange (NYSE).
NYSE margin debt is the amount of money borrowed by customers of NYSE member firms to buy securities. And margin debt tends to peak just before the market crashes. For example, the last two peaks in NYSE margin debt levels preceded the 2000 dot-com bubble and the 2007-2009 bear market.
Today, NYSE margin debt is within 2% of its all-time high… and it appears to be peaking.
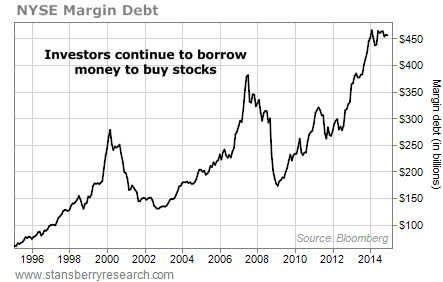 This is another sign that the bull market may be nearing an end.
As I said, it’s not time to get out of stocks yet. But it’s time to become cautious… and keep an eye on these indicators.
Good investing,
Brian Weepie
[ad#stansberry-ps]
Source: Growth Stock Wire
