The Bernanke Asset Bubble will celebrate its sixth birthday this March…
But this bubble still has plenty of room to run…

Stocks are nowhere near “bubble” valuations today. And that means our upside is still high.
Let me explain…
Longtime readers know my Bernanke Asset Bubble thesis… It was the simple idea that the Federal Reserve would keep interest rates lower than anyone could imagine, for longer than anyone could imagine.
[ad#Google Adsense 336×280-IA]Ben Bernanke started this policy and Janet Yellen has filled Bernanke’s shoes.
She’s doing the same thing he did… Keeping interest rates at zero.
I said that would cause asset prices (like stocks and real estate) to soar higher than anyone could imagine.
That’s been 100% correct so far.
And U.S. stocks have gotten more and more expensive since.
But stocks are actually NOT at “bubble” valuations yet…
You see, typically at major stock market peaks, stocks reach “bubble” valuations before it’s finally over. But that’s not the case today.
The most common measure of stock market value is the price-to-earnings (P/E) ratio. Basically, high is bad and low is good.
Today, the stock market (the S&P 500 Index) trades at a P/E ratio of 18.3.
The long-term average P/E ratio is around 16… So stocks today are slightly more expensive than normal… but they certainly aren’t outrageously expensive. (Stocks are actually trading at a P/E of 16 based on 2015 earnings estimates.)
The thing is, you can’t just look at the P/E ratio by itself… You have to look at the economic situation.
We came up with a simple metric to take the economic situation into account… by adding the P/E ratio and interest rates.
You see, the level of interest rates has a lot of information built into it… It has inflation expectations… economic growth expectations… and whether or not the Fed is being accommodative (implementing policies to stimulate the economy) or restrictive (implementing policies to “cool” the economy).
The point is, we need to know what’s going on with earnings AND interest rates to know what’s really happening with stock valuations.
The chart below takes the P/E ratio and adds short-term interest rates. If the P/E is 10, for example, and short-term interest rates are 5%, our indicator shows a value of 15.
It’s that simple. (We did smooth out a few nasty recessions that forced earnings to near zero.)
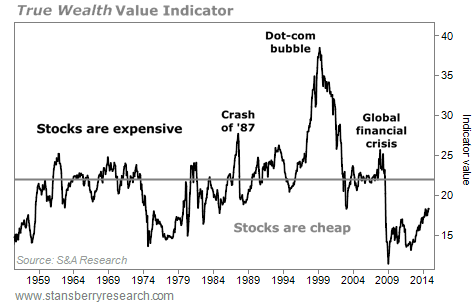 Today, P/E ratios are slightly elevated, but interest rates are near zero. So compared with history, today’s level shows stocks are STILL not expensive.
As you can see, stocks are a much better deal today (in an environment of no inflation and low interest rates) than they were in 1980, when inflation and interest rates were in the double digits.
The number 22 is the magic number for this indicator. When this indicator is below 22, stocks return 12.3% over the next 12 months. But when it’s over 22… stocks fall over the next 12 months.
Today’s reading is below 19 – so we are not in a danger zone yet. And clearly we’re nowhere near “bubble” valuations in U.S. stocks.
This conclusion might seem controversial… but it is simply based on the facts.
Yes, U.S. stocks have gone up for almost six years. But don’t look backward… look ahead. And looking ahead at 2015, the U.S. is STILL an excellent place to put your money to work.
Don’t let fear or emotions push you out of U.S. stocks. You want to own them in 2015!
Good investing,
Steve
[ad#stansberry-ps]
Source: Daily Wealth
