
The downtrend in copper continues.
Over the past two years, we’ve written bearishly about the metal’s prospects.
Copper is down around 16% over the past year… and 24% over the past two years.
And the trend shows no signs of reversing…
Take a look at this weekly chart of copper…
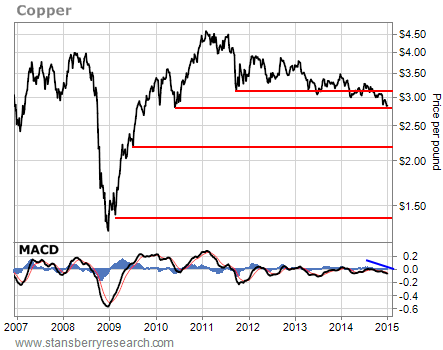
Copper broke down from its high at $4.50 per pound back in 2011. On Friday, the metal closed right on critical, long-term support at $2.80 per pound – a downside target we first pointed out in March 2013.
[ad#Google Adsense 336×280-IA]Now that copper has hit that long-term downside price target, I’d love to tell you the price is ready to reverse and copper should head higher from here.
But I can’t.
The chart is just too ugly.
Look at the Moving Average Convergence Divergence (MACD) momentum indicator at the bottom of the chart.
It has been falling over the past several months along with the price of copper.
This means the downtrend is intact and the price is likely to continue lower.
If copper breaks below the $2.80 level, it could kick off a steep decline all the way down to the next support line at $2.20. A failure to hold that level then brings the $1.40 support line into play.
We’ve seen this sort of “waterfall decline” in copper before. Just look at the action back in 2008 – when copper fell from $4.00 per pound all the way down to $1.30 in just six months. It looks like something similar could happen again.
Best regards and good trading,
Jeff Clark
[ad#stansberry-ps]
Source: Growth Stock Wire
