
 It has been a long time since the stock market experienced a significant correction.
We used to get one or two corrections of 10% or more each year in a bull market. But we haven’t had a pullback of that size for more than three years.

The brutal decline earlier this month pushed the S&P 500 9.6% below its September high… But there’s likely going to be at least one more push lower.
Let me explain…
[ad#Google Adsense 336×280-IA]Typical market corrections unfold in either three or five distinct legs.
The first move shakes up folks, gets the bears all loaded up with short positions, and shifts sentiment rapidly from bullish to bearish.
That was the decline we saw two weeks ago.
The next leg is an oversold bounce.
This move forces short sellers to cover – often at a loss, especially if they got too aggressive and sold short into oversold conditions. The bulls scramble to get back in, and sentiment shifts rapidly back to bullish. That’s where we are now.
The third leg of a correction is a move back down to retest the lows of the first leg. It’s usually a fast and uncomfortable move that gets the bulls to finally cry “uncle.”
We’re gearing up for that third leg.
Take a look at the mid-2011 correction in the S&P 500…
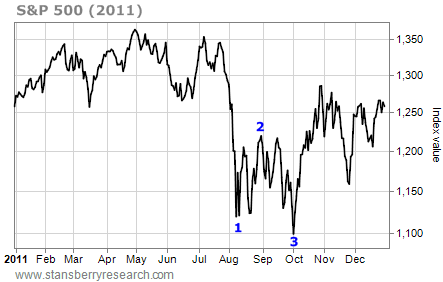 The S&P 500 was trading near 1,350 toward the end of July 2011. Then it fell 225 points – nearly 17% – at the end of the first down-leg in early August. The index then bounced and recovered nearly 50% of the decline by the end of August. That was the second leg.
The third leg of the correction pushed the index all the way back down below the August lows. That’s when we hit the final bottom.
If we go back a little further to mid-2010, we can see what a five-legged correction looks like…
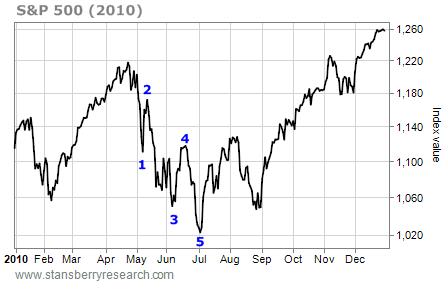 The S&P 500 peaked at 1,220 in mid-April 2010. It fell 9% to 1,100 by early May. The 60-point bounce that month recovered more than 50% of the initial drop. Then the index turned lower again and made a new correction-phase low in early June. One more oversold bounce and one more decline to a final bottom in July completed the correction process.
Of course, it doesn’t have to happen that way. But that is usually how correction phases unfold.
People have short memories. We live “in the moment.” And our investment biases favor our most recent experiences. It has been more than three years since the S&P 500 experienced a “real” correction of 10% or more.
Most people seem to be breathing a sigh of relief that the market rallied so strongly last week. Most analysts and TV talking heads confidently state that the selling is over and the market is now on its way to making new highs for the year.
I’m not so sure.
So far, the current correction has only completed two legs. Here’s the chart…
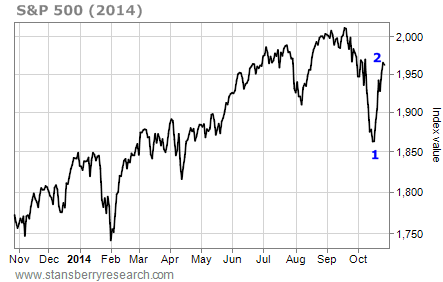 The S&P 500 peaked at 2,019 last month. It fell fast, all the way to 1,960 on a closing basis by October 15. (It dipped all the way down to 1,820 intraday. But since we’re using daily charts to look at the 2010 and 2011 corrections, we should be consistent here.) On a closing basis, the S&P 500 lost 7.9% when it reached point 1 on the chart.
Last week’s bounce recovered 56% of that decline. That’s in line with the oversold bounces we saw in 2010 and 2011.
Guess what comes next?
It doesn’t have to play out this way. But if previous corrections provide a roadmap, stocks have to endure at least one more leg down before we declare an end to this correction phase.
As I showed you last week, technical indicators like the McClellan Oscillator – which measures overbought and oversold conditions – are in extremely overbought territory. So it’s not time to be rushing in to the market and buying stocks.
Be cautious. Wait for a retest or a slight breach of the lows from two weeks ago before buying stocks aggressively. Or at the very least, wait for a short period of consolidation to give the market a chance to work off the current overbought condition.
Like I said earlier, it has been a long time since the stock market experienced a real correction phase. Most people aren’t prepared for another move lower. But based on history, you should be.
Best regards and good trading,
Jeff Clark
[ad#stansberry-ps]
Source: Growth Stock Wire
