
 Things are changing fast in today’s market.
One week ago, stocks were in the midst of a violent selloff. It looked like the market was ready to dive off a cliff.
But [in my last essay], I told you Volatility Index (“VIX”) option prices showed stocks were set to rally.
That’s exactly what happened. Now, stocks have recovered a good chunk of what they lost in the decline.
[ad#Google Adsense 336×280-IA]But as I said, things are changing fast. And today, we’re getting “sell” signals…
When the market is this volatile, technical indicators and the signals they generate change quickly.
“Buy” signals can turn into “sell” signals the next day. Traders need to pay attention and be willing to change course.
For example, three weeks ago, the S&P 500 lost 2.5% in just four trading days.
So I surprised a lot of my S&A Short Report subscribers when I told them it was time to buy stocks on October 2.
The NYSE McClellan Oscillator (the “NYMO”) had reached extremely oversold levels. Oversold readings in the NYMO signal the potential for stocks to move higher. And that’s exactly what happened.
By the time the market closed on October 3, the S&P 500 recovered nearly all of its losses of the week. And the NYMO had flipped back to a neutral reading – suggesting traders should take profits. I was able to pocket a solid gain from the trade I made the day before.
Last week, the NYMO generated two more “buy” signals. But by the end of the trading day on Tuesday, the NYMO flipped back to a “sell” signal.
Take a look…
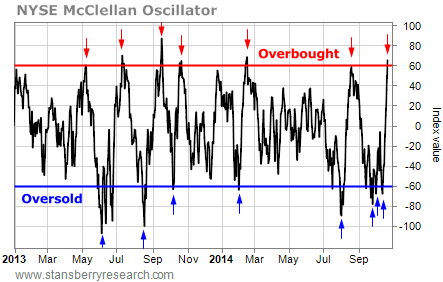
Remember, readings below -60 point to oversold conditions and signal the potential for stocks to move higher. Readings above 60 signal overbought conditions and warn of an impending decline in the market.
So Tuesday’s reading is warning of a decline in stock prices.
VIX option prices have also changed course this week.
As I told you on Tuesday, when most people buy or sell stock options, they focus on what the VIX is doing. The VIX is a widely followed indicator that measures the prices of options on the broad market. It rises and falls with investor fear levels. We want to buy when the VIX makes an extreme move to the upside (when people are scared). And we want to sell when the VIX makes an extreme move to the downside (when people are complacent).
The VIX is a good contrary indicator, but there are different degrees of fear and complacency. And it’s hard to tell just by watching the VIX whether we’re nearing the beginning or the end of a fearful or complacent move.
That’s where VIX option prices come in.
VIX options are European-style contracts – meaning they can only be exercised on option-expiration day. And they provide terrific clues about where most traders expect the VIX to be in the future.
At last Friday’s close, the VIX was at 22. And the VIX December 22 calls were trading for $2.15, while the December 22 puts were at $4.30. So option traders were willing to pay twice as much to bet on the VIX moving lower than on it moving higher by December expiration day.
In short, VIX option traders expected volatility to move lower over the next few months. And falling volatility usually translates into rising stock prices. So on Tuesday morning, I said it was likely we’d see a year-end market rally.
VIX option traders were right… But it didn’t take until the end of the year. It happened in just two trading days.
By the end of the day on Tuesday, the VIX had collapsed by 30%. Meanwhile, the S&P 500 was 53 points higher than where it closed on Friday.
Now, VIX option traders are less bullish. On Tuesday, the VIX closed just above 16. The VIX December 16 calls closed at $2.60, while the VIX December 16 puts closed at $1.50.
Option traders are now betting on the VIX moving higher than on it moving lower by the December expiration day. And a rising VIX usually goes along with falling stock prices.
So after the strong bounce in the market earlier this week, VIX option prices and the NYMO are telling traders to look for a decline in stock prices. If you bought stocks based on these indicators’ recent “buy” signals, I recommend taking profits.
This is what happens in a wild market environment. Moves that used to take weeks or months to develop happen within a few trading days. That doesn’t mean the technical indicators are wrong. The NYMO and VIX option prices have been dead-on accurate. But they are changing a lot more often.
If you want to be a successful trader in today’s market, pay attention to these indicators (you can track the NYMO here and VIX option prices here) and be ready to change course fast.
Best regards and good trading,
Jeff Clark
[ad#stansberry-ps]
Source: Growth Stock Wire
