
 I was on stage at The California Club in Los Angeles… being put on the spot. And I didn’t have a good answer…
It was a private meeting, so it was a small crowd of less than 50 people. At the end of my speech, I answered a few questions.
I like to give good answers when I can. But this time, I didn’t have a good answer. I fumbled around, sharing some facts. But I knew I could give a more accurate answer once I had run some numbers. I promised that I would respond more accurately in DailyWealth. So here goes…
[ad#Google Adsense 336×280-IA]”Steve, you did some great work on cycles years ago,” an attendee said.
“So exactly where are we in this cycle, based on the last 100 years?”
He was asking for the BIG picture. I like that.
Most people focus on today, and forget about the big picture.
I could answer this question in a variety of ways. But the chart below is the simplest way to answer it…
The big idea is, the stock market goes in big cycles, from being loved to being hated.
For example:
- Stocks were loved in the decade of the “Roaring Twenties.” Then they crashed in the Great Depression, and then World War II came along.
- Stocks were loved in the 1990s, then spent much of the 2000s going nowhere, delivering no return at all, really (when you adjust for inflation).
The question is ultimately getting at this: After soaring since 2009, are stocks overly loved right now?
For your answer, take a look at this chart. It shows the 10-year annualized return on stocks (after inflation).
You can see the peaks were around the Roaring Twenties, and the dot-com boom. You can see the busts around the Great Depression and the inflationary 1970s.
The important thing to look at is where we are today…
Take a look:
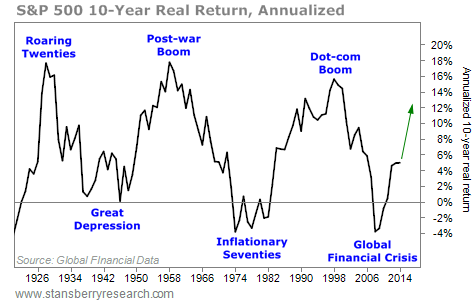
So, where are we in this cycle? Are stocks overly loved, like they were in 1929 or 1999? Or are they overly hated, like they were in the Great Depression or the 1970s?
Based on this simple chart, we are somewhere in the middle… Stocks aren’t overly hated, or overly loved. Based on history, we are somewhere in the middle of this cycle.
I will admit, this is not the most statistically robust way to look at things… After all, there are only three of these major cycles to look at over the past 100 years. How can we say for sure that stocks will peak in the same place they peaked the last three times? We can’t.
This is simply a rough look at history. I believe it’s about right, though…
I think we’re not at the bottom, and we’re not at the top either.
I think we have a couple more innings left in this great bull market. And based on history, the last inning often delivers some of the biggest gains.
So, in short, yes, stocks have moved up a lot since 2009. But based on the last three cycles over the past 100 years, there’s still plenty of room to run…
Good investing,
Steve
[ad#stansberry-ps]
Source: Daily Wealth
