The stock market was hit hard last week.
The S&P 500 gave up all of its gains for the month. It ended July down 2.5%.

[ad#Google Adsense 336×280-IA]The Dow Jones Industrial Average fared even worse.
Not only did the Dow give up all of its gains for the month, it’s now down for the year.
So could this be the intermediate-term correction everyone has been waiting for?
Maybe. It has been a couple of years since we’ve seen even a 10% pullback in the stock market. So we’re certainly ripe for one.
But I wouldn’t be too quick to jump in and aggressively short sell the market right now. Stocks are primed for a big bounce. And that’s why I’m buying.
Let me explain…
Take a look at this chart of the NYSE McClellan Oscillator (NYMO)…
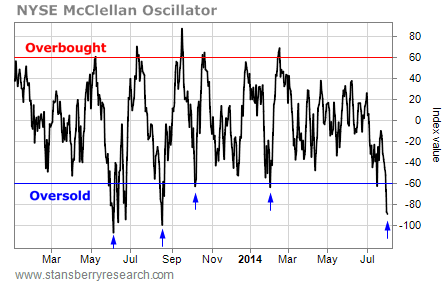
The NYMO is a measure of overbought and oversold conditions in the stock market. It has a terrific track record of signaling short-term reversals in the stock market.
Readings above 60 signal overbought conditions and warn of an impending decline in the market. Readings below -60 point to oversold conditions and signal the potential for stocks to move higher.
Friday’s reading of -89 is only the fifth “buy” signal we’ve gotten from the NYMO over the past two years. Here’s how the previous four signals lined up with the S&P 500…
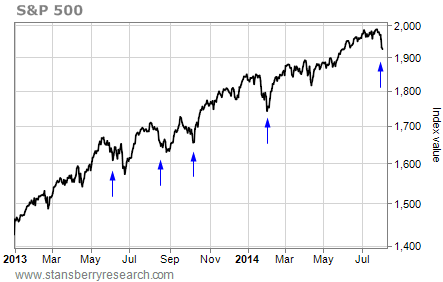
The NYMO buy signal didn’t always mark the exact bottom of the decline phase for the S&P 500. But in each of the four previous signals, stocks were higher four weeks later. Those are good enough odds to get me interested in buying stocks.
And this chart of the Chicago Board of Options Exchange (CBOE) Put/Call Ratio sealed the deal…
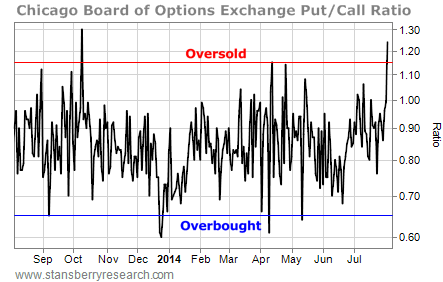
This Chicago Board of Options Exchange Put/Call Ratio is the number of puts traded on the CBOE divided by the number of calls traded. It’s another measure of overbought and oversold conditions.
Readings below 0.65 signal overbought conditions and warn of an impending decline in stock prices. Readings above 1.15 are oversold and signal the potential for a bounce in the market.
On Friday, the CBOE put/call ratio closed at 1.24. That’s the highest level since October. Back then, this signal marked the exact bottom of the decline phase for the stock market. The S&P 500 gained 12% over the next 10 weeks.
I can’t tell you the same thing will happen this time around. But the extreme oversold readings we’re seeing on the NYMO and the CBOE put/call ratio imply stocks are primed for a big bounce.
So if you’re anxious to short stocks in anticipation of a big decline, you should wait until the bounce unfolds and you can short stocks at higher levels. But if you’re looking for a chance to profit from the upside, this is about as good a spot as any to make a quick trade.
Best regards and good trading,
Jeff Clark
[ad#stansberry-ps]
Source: Growth Stock Wire
