
We called it a “make or break” moment…
In early April, our “end of the bull market” indicator seemed close to flashing the same warning sign it did in 2000 – at the end of the spectacular Internet bubble.
We were bullish at the time. But if the sign flashed, we said, “We’ll need to think about making some major changes to our mostly bullish trading plan.”
As it turns out, the warning sign didn’t flash. It faded. And just recently, our indicator made an important move in the opposite direction…
Today, we’ll take another look at this indicator.
We’ll explain why it’s valuable… what it has shown us in the past… and why this recent move could be a major bullish signal.
We’ll also show you which stocks are likely to see the biggest gains.
So let’s get started…
The indicator is a combination of two stock market indexes: the benchmark S&P 500 Index and the S&P 500 Equal Weight Index.
Specifically, it’s a ratio of the two.
To understand how it works, we need to first look at each index individually…
The S&P 500 is a “market-cap weighted” index. This means that larger companies carry heavier weightings… and smaller companies carry lighter weightings.
Consumer-electronics giant Apple (AAPL), for example, has a 4.2% weighting in the index. But tire maker Goodyear Tire & Rubber (GT) only carries a 0.03% weighting. That means Apple has roughly 150 times more influence on the index’s movements than Goodyear.
In other words, the smaller businesses are mere drops in the bucket. They can barely make ripples. But the bigger businesses can make a splash.
For this reason, looking at the S&P 500 is useful – but it doesn’t provide a complete picture…
That’s why we also like to look at the S&P 500 Equal Weight Index. In this index, all S&P 500 stocks are given about a 0.2% weighting (100% divided by 500 stocks).
When we compare these two indexes, we gain insight into the state of the market…
When the standard S&P 500 Index outperforms the Equal Weight Index in a rising market, it means the biggest businesses are leading the charge. And when the Equal Weight Index outperforms, it means the gains are more evenly spread across the 500 stocks in the indexes.
The same is true for losses in a falling market.
This is important information. And we can see it clearly in a ratio chart…
If we take the Equal Weight Index and divide it by the standard S&P 500, we get the Equal Weight-to-S&P 500 ratio. When the ratio is rising, the Equal Weight Index is outperforming. And when the ratio is falling, the standard S&P 500 is outperforming.
In a typical bull market, the ratio usually rises… because small businesses (and stocks) tend to benefit more than large ones when times are good. When the ratio drops, the market as a whole usually struggles… and big businesses tend to weather the storm better than small ones.
You can see this in the chart below, from our December 5 DailyWealth Trader (DWT) issue. The exception to the rule is 2017, when the ratio (the black line) dropped and the S&P 500 (the blue line) soared…
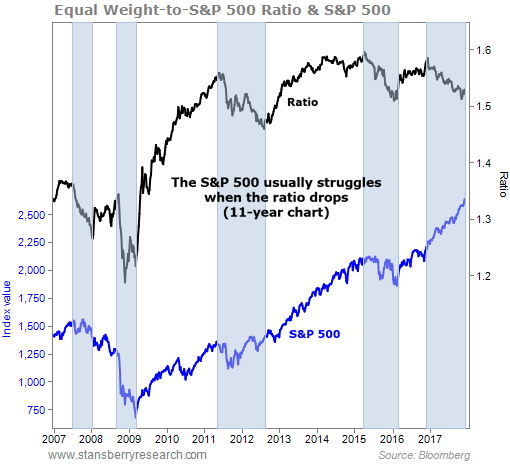 In 2017, large businesses carried the market higher. Market leaders like Apple, Amazon (AMZN), Netflix (NFLX), and Alphabet (GOOG and GOOGL) rallied to new all-time highs, while smaller stocks didn’t perform as well. So the ratio fell. But the overall market kept soaring.
If we go further back in time, we can see this also happened during the Internet bubble…
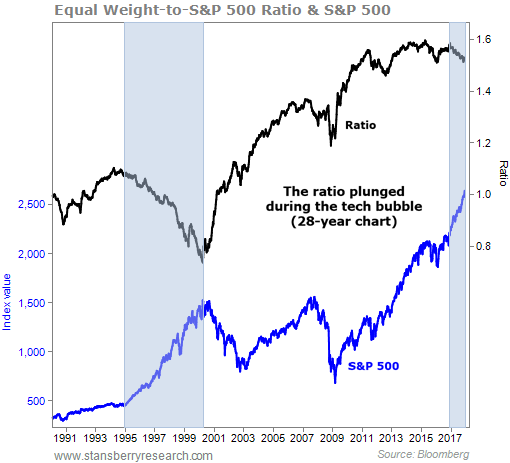 Again, this isn’t “normal” bull market behavior. A falling ratio and a soaring market hint at a sort of mania in certain large stocks. When the ratio broke higher in 2000 – and the S&P 500 fell – it signaled the end of the mania.
The stocks that led the market higher also led it lower. The smaller companies performed better, by comparison.
This brings us to our “make or break” moment in April…
The ratio had just broken its downtrend. So if the S&P 500 started falling, it would have been a major warning… like the one that set off the bust in 2000.
As you can see in the chart below, though, the S&P 500 turned higher. And that pushed the ratio lower. Recently, the ratio hit a major new low…
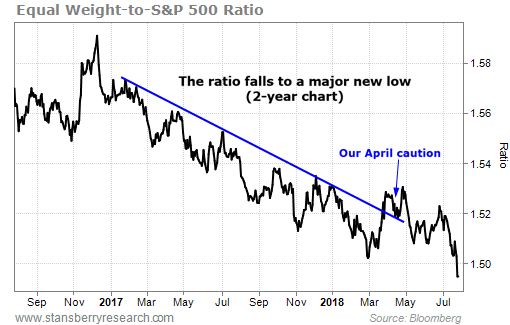 In other words, stocks are still behaving like they did during the Internet bubble. The biggest businesses are leading the charge higher. And now that the Equal Weight-to-S&P 500 ratio broke lower, that action is likely to continue…
The five largest businesses in the S&P 500 are Apple, Microsoft (MSFT), Alphabet, Amazon, and Facebook (FB). All five are trading at or just shy of their all-time highs.
We hold positions in both Apple and Amazon in DWT. And we’re up more than 100% on each.
If you’re not already holding Big Tech stocks, look for opportunities to buy. These are the stocks that have led and will likely continue to lead for the remainder of the bull market.
Good trading,
Ben Morris and Drew McConnell
The legendary stockpicker who built one of Wall Street's most popular buying indicators just announced the #1 stock to buy for 2026. His last recommendations shot up 100% and 160%. Now for a limited time, he's sharing this new recommendation live on-camera, completely free of charge. It's not NVDA, AMZN, TSLA, or any stock you'd likely recognize. Click here for the name and ticker.
Source: Daily Wealth
