

I couldn’t care less about a stock’s fundamentals.
Now, don’t get me wrong… If you’re buying a stock and planning to hold it for years, fundamentals are critical. But in the short term, fundamentals don’t matter.
Instead, what I focus on is technical analysis. This kind of trading shows you what’s happening in the markets right now – the patterns of buying and selling that are taking place in the moment.
In my experience, too many investors spend their time wondering why the market is moving instead of focusing on how to profit from it.
Right now, the patterns I’m seeing are telling me that something big is coming. We’re nearing a huge inflection point in the markets… And I want you to take advantage of it.
Some people think technical analysis is all about chart reading. But it’s much more advanced than that. The biggest component of technical trading is about behavioral finance.
Human behavior – what investors are doing in the markets – never changes. And if you study history and obsess over patterns, you’ll see that behavior in the markets goes in cycles.
In other words, what has happened before will typically happen again.
This is a technical concept called “time cycles.” It comes from legendary trader W.D. Gann, a market theorist from the early 20th century. He found that markets move in symmetrical cycles. If you can understand them, you’re better able to predict tops and bottoms in the market.
For example, as I recently showed my readers, the stock market appears to reach an important turning point every nine years…
- 1982: In March 1982, we saw a short-term bottom in the Dow Jones Industrial Average that led to a double-digit rally… and eventually a meteoric rise that ended in March 1991.
- 1991: After the spike ending in March, the Dow Jones traded sideways all year. In this case, our turning point was different – the market hit a wall.
- 2000: The “dead money” of 1991 gave way to another huge rise – culminating with the peak of the tech-stock bubble in March 2000. From 1992 to the top, the Nasdaq 100 Index skyrocketed about 1,300%.
- 2009: Nine years after the dot-com peak, the market bottomed out during the Great Recession in March 2009.
Now, over the past nine years, we’ve seen a historic bull market. It’s a safe bet that we’re approaching an important moment… a major turning point for investors.
Based on history, I knew at the very least that last month was going to be a seriously volatile period for stocks. Sure enough, over a period of 10 trading days in March, the S&P 500 Index fell more than 7% – a huge move for a major market index.
So what’s coming next? How long will all this volatility continue? Time cycles may provide an answer…
In September, I noticed the market forming an interesting pattern – one that I’d seen before. You see, over a 26-month period from March 2009 to May 2011, the Dow Jones Transportation Average more than doubled. And it looked like something remarkably similar was happening again…
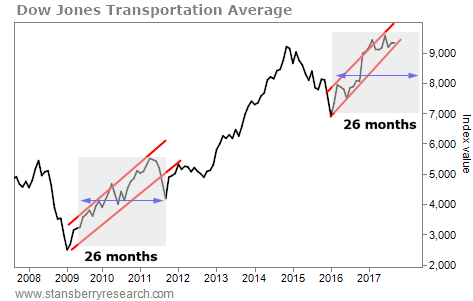
The last time we saw a 26-month run like this, the market stalled out before continuing higher.
I told my readers that based on history, a similar correction could happen again in the spring. And that’s just about what happened… The markets fell 10% or more in early February.
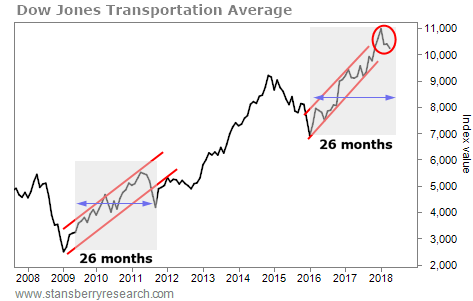
Time cycles were able to tell us a correction was coming.
Not only that, but we can also see from 2011 that the recent correction could be another powerful catalyst for another leg higher – in today’s case, what my colleague Steve Sjuggerud calls the “Melt Up.”
How long before this rally could start? We can’t know for certain. But when the first cycle top concluded in 2011, the period of volatility lasted three to five months.
Should that be the case this time around – and I believe it will – that will take us right into May.
Looking beyond that point… last year gave us the lowest volatility we’ve seen in years. I think that we are at an incredible inflection point in the markets that could potentially flip that on its head.
Technical analysis shows that when we reach these key moments in the market, we tend to see extreme moves in one direction or the other. That volatility gives us a chance to hit some home runs.
I believe we’ll see extraordinary trading opportunities in the next two to three years. That’s why we need to take advantage of this now – while this period lasts.
The markets will soon reach a critical point. But I’m not so concerned with whether they will go up or down. I’m concerned with the what and when… meaning what prices are going to do and when. I’m focused on how to trade what the market gives us.
That’s how we’ll make big profits… by hitting singles while we wait for our chance at a home run.
Good investing,
Greg Diamond
I recently visited Mar-a-Lago... And now I'm prepared to put my reputation on the line. Since 1998, my proprietary system would've returned 13,126% in backtests. (That's 13X the S&P and 106X the average investor, according to JP Morgan.) However, one investment I just uncovered could be my biggest winner of all... It involves President Trump, Elon Musk, trillions of dollars, China... And a MAJOR upgrade to the artificial intelligence revolution. See for yourself!
Source: Daily Wealth
