The healthcare improvement company that is headquartered in Charlotte, N.C, Premier Inc. (NASDAQ: PINC) shows signs of an upcoming price surge based on its latest charts.
Bullish Indications
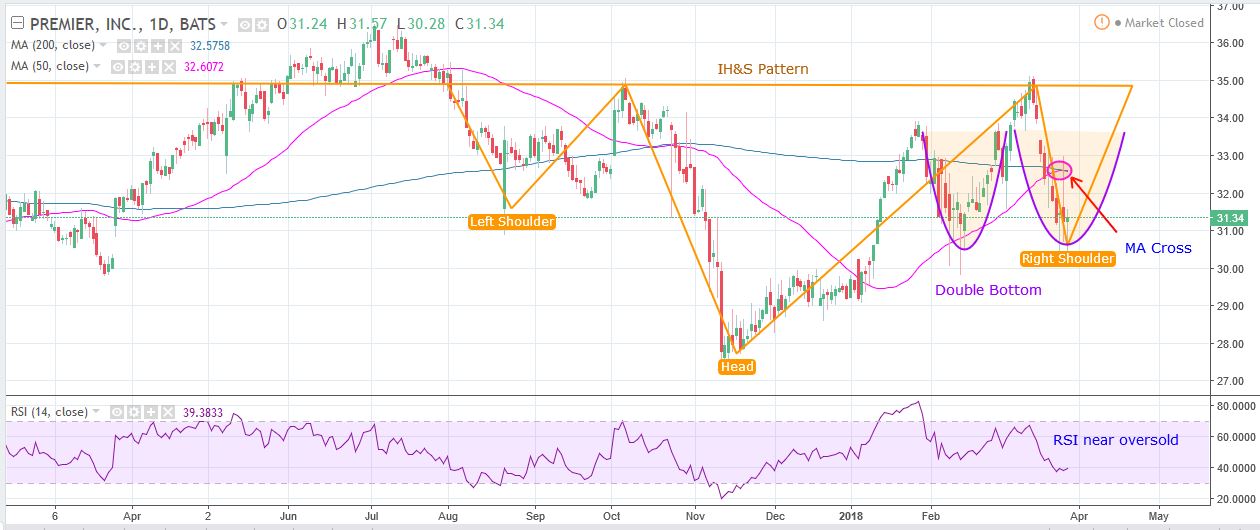
#1 IH&S Pattern in Daily chart: As you can see from the daily chart of PINC below, over the past several months, the stock has been forming an Inverted Head and Shoulders (IH&S) pattern. The left shoulder was formed between August 1, 2017, to October 6, 2017, head was formed between October 6, 2017, to March 13, 2018, and the right shoulder is currently being formed. An IH&S pattern is a strong bullish pattern. After the completion of this IH&S pattern, the stock may move higher in the short term.
Daily Chart – PINC
#2 MA Golden Cross: When short-term moving average crosses above the longer-term moving average, it is called as Golden cross and indicate a possible upcoming bullish movement. The stock’s 50-day SMA had crossed above 200-day SMA, indicating bullishness.
#3 Double Bottom: From the daily chart of PINC, we can see that the stock is currently forming a Double Bottom pattern.
This is marked in the chart in purple color. A double bottom pattern is a strong bullish pattern and indicates a possible upmove in the short term.
#4 RSI Nearing Oversold: In the daily chart, the RSI is currently nearing oversold levels, indicating a bullish setup.
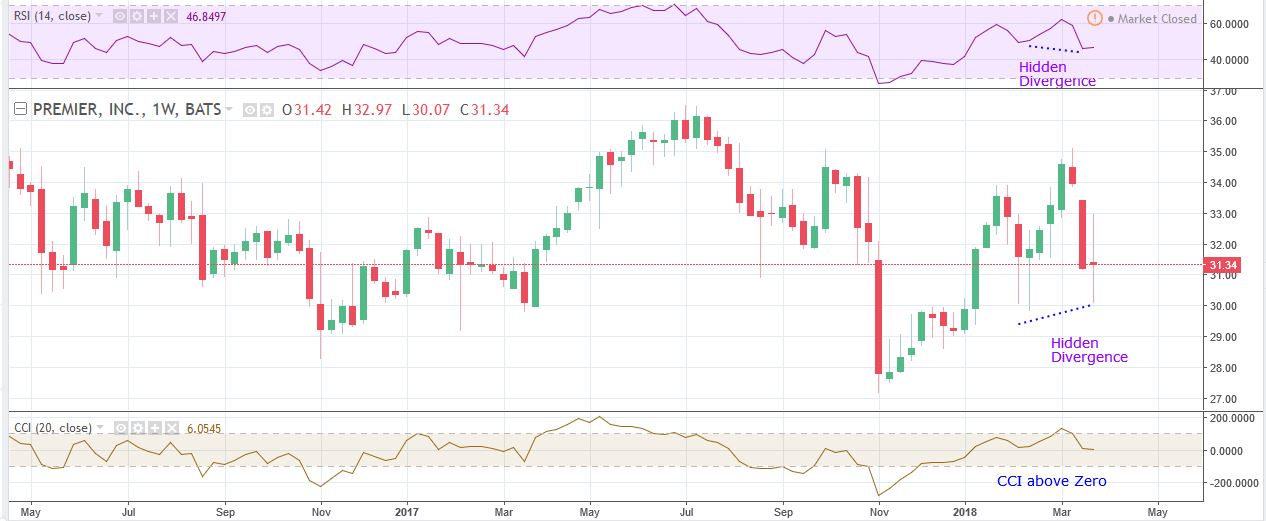
#5 Hidden Divergence in Weekly Chart: The weekly chart of PINC shows that there is a hidden divergence between RSI and price.
The price made a higher low while the RSI made a lower low. Hidden divergences indicate underlying strength. Even though there was selling pressure, the price did not break the previous low, which is a sign of strength.Hidden divergences are usually a signal of trend continuation, an uptrend in this case.
Weekly Chart – PINC
#6 CCI Above Zero: CCI has been above the zero line for the past few weeks, indicating bullishness.
Recommended Trade (based on the charts)
Buy Price: If you want to get in on this trade, you can purchase the shares of PINC at the current price of $31.34.
TP: Our target prices are $35 and $45.
SL: To limit risk, place a stop loss below the shoulder of the IH&S pattern. This translates to $29.50. Note that this stop loss is on a closing basis.
Our target potential upside is almost 12% to 44% in the next 3-6 months. For a risk of $1.84, our target rewards are $3.66 and $13.66. This is a 1: 2 and 1:7 Risk-Reward trade.
In other words, this trade offers nearly 2x to 7x more potential upside than downside.
Risks to Consider
The stock may reverse its overall trend if it breaks down with high volume from the current levels before completing the formation of the Inverted Head and Shoulders pattern. The sell-off of the stock could also be triggered in case of any negative news, overall weakness in the market, or any regulatory changes in the sector.
Happy Trading!
Tara
To carry out Trump's Executive Order #14196 initiative, the administration will have to partner with a handful of U.S. companies that control the "reserve accounts" sitting on trillions of dollars' worth of untapped natural resources. I've spent months digging into this – and I've identified three companies that have already been granted "emergency status" and fast-track approvals. I believe their shares could skyrocket once new capital starts moving into the sector. See the three stocks that I expect to be the biggest winners as this plan rolls.
