Major American manufacturer of household products, Church & Dwight Co., Inc. (NYSE: CHD) seems to be gearing up for a surge as per its latest charts.
Bullish Indications
#1 MA near crossover: As you can see from the daily chart of CHD below, the short-term moving average of 50-day SMA is about to cross above the longer-term moving average of 200-day SMA.
Such crossovers indicate a possible upcoming bullish movement.
The stock is also currently trading above its 50-day and 200-day SMA, which implies that the bulls are still in control.
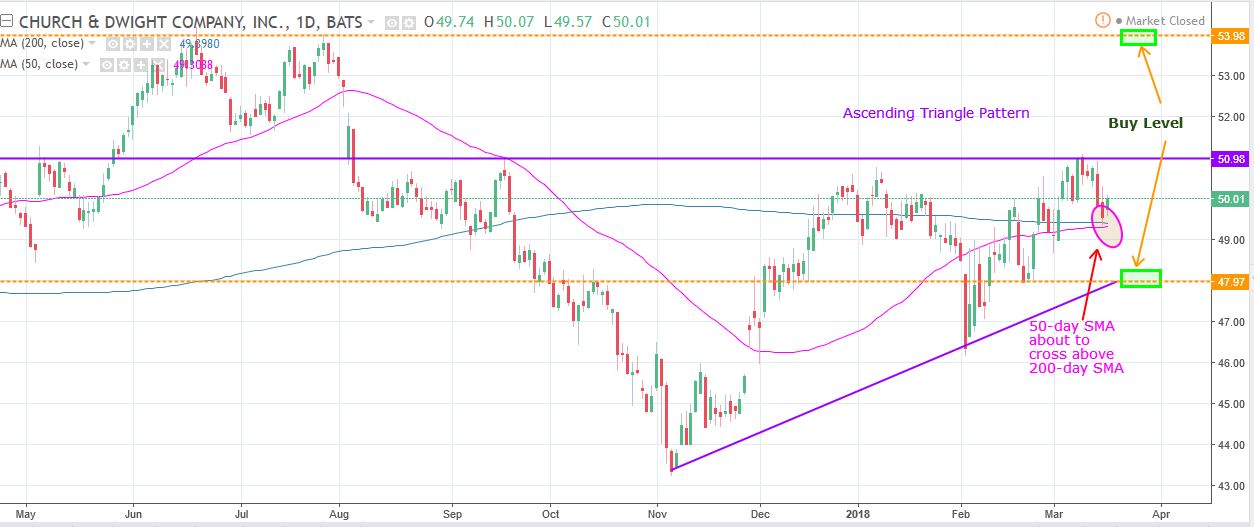
Daily Chart CHD
#2 Ascending triangle pattern: CHD’s daily chart shows that the stock is currently forming an Ascending Triangle pattern. An Ascending Triangle pattern is a bullish pattern. This is marked on the daily chart in purple color. The base of the triangle also generally acts a good support level.
#3 Double Bottom Pattern: From the weekly chart of CHD, we can see that the stock is currently forming a Double Bottom pattern. This is marked in the chart in purple color. A double bottom pattern is a strong bullish pattern and indicates a possible upmove in the short term.
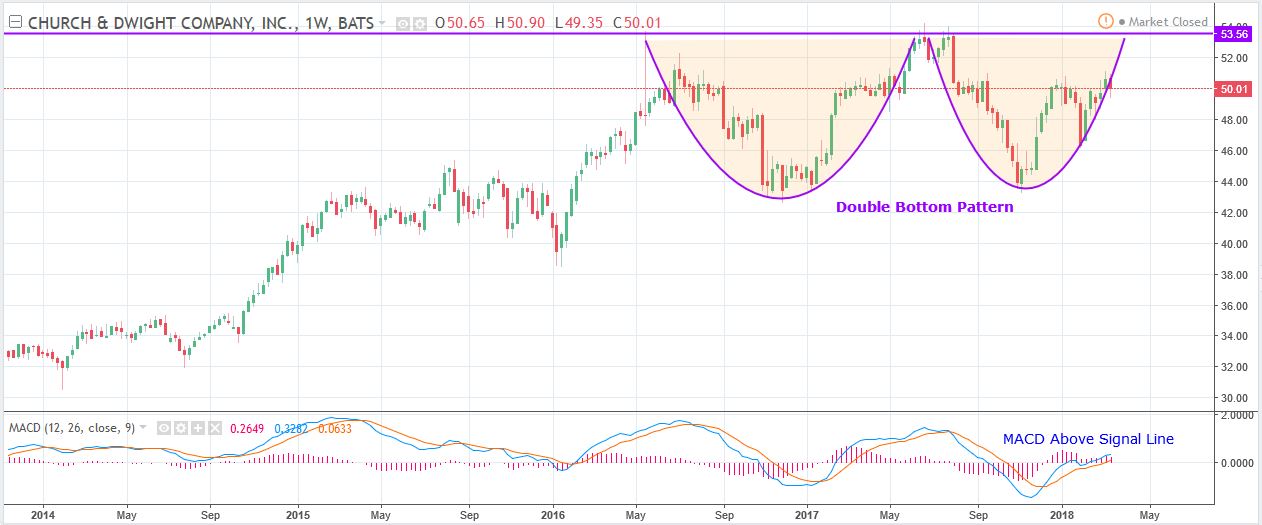
Weekly Chart CHD
#4 MACD Above Signal Line: As you can see from the weekly chart, the MACD line (blue color) is currently above the signal line (orange color), indicating a bullish bias. The stock is also currently trading above its 50-week and 200-week moving average which is another positive sign.
Recommended Trade (based on the charts)
Buy Levels: If you want to get in on this trade, you can purchase half the intended quantity of shares at the current price of $50.01. You can purchase the remaining shares in either of the two scenarios
- If the stock pulls back and reaches the bottom of the ascending triangle pattern in the daily chart, at $47.90.
- If the stock crosses above the neckline of the double bottom pattern of the weekly chart, at $54.
These buy levels are marked in the daily chart as a green rectangles.
TP: Our target prices are based on the breakout from Ascending Triangle pattern and double bottom pattern. The first target price is $65 and second target price is $70.
SL: To limit risk, place a stop loss at $45.50. Note that this stop loss is on a closing basis.
Our target potential upside is nearly 20% to 46% in the next 4-5 months.
- Entry at $47.90: For a risk of $2.40, the target rewards are $17.10 and $22.10. This is a nearly 1:7 and 1:9 risk-reward trade.
- Entry at $50.01: For a risk of $4.51, the target rewards are $14.99 and $19.99. This is a nearly 1:3 and 1:4 risk-reward trade.
- Entry at $54: For a risk of $8.5, the target reward (TP#2) is $16. This is a nearly 1:2 risk-reward trade.
In other words, this trade offers nearly 2X to 9X more potential upside than downside.
Risks to Consider
The stock may reverse its overall trend if it breaks down with high volume from the double bottom pattern and ascending triangle breakout level. The sell-off of the stock could also be triggered in case of any negative news, overall weakness in the market, or any regulatory changes in its sector.
Happy Trading!
Tara
To carry out Trump's Executive Order #14196 initiative, the administration will have to partner with a handful of U.S. companies that control the "reserve accounts" sitting on trillions of dollars' worth of untapped natural resources. I've spent months digging into this – and I've identified three companies that have already been granted "emergency status" and fast-track approvals. I believe their shares could skyrocket once new capital starts moving into the sector. See the three stocks that I expect to be the biggest winners as this plan rolls.
