Entergy Corporation (ETR), the integrated energy company, appears to be ready for a spectacular recovery as per its latest charts.
The stock has been steadily ticking down over the past few weeks.
However, it appears as if this is all about to change, as the latest indications on the chart show that ETR could roar back to prominence in the next 1-2 months.
Following are the bullish indications for ETR in its charts.
Bullish Move – Chart Indications
#1 Strong Support: As you can see from the daily chart of ETR, there is a strong support level near $79.50 (the blue dotted line). This support was a previous resistance level that was tested multiple times before the stock managed to finally break through it. Hence, this resistance-turned-support level is now a strong support for ETR.
#2 Fibonacci Levels: The Fibonacci retracement levels indicate that the key Fibonacci ratio of 61.8% is around $79.5, indicating that the stock is quite unlikely to break down from that level. Typically, after an up-move, stocks retrace to any of the key Fibonacci levels before surging back again. For ETR, this retracement level appears to be $79.5 as per the chart.
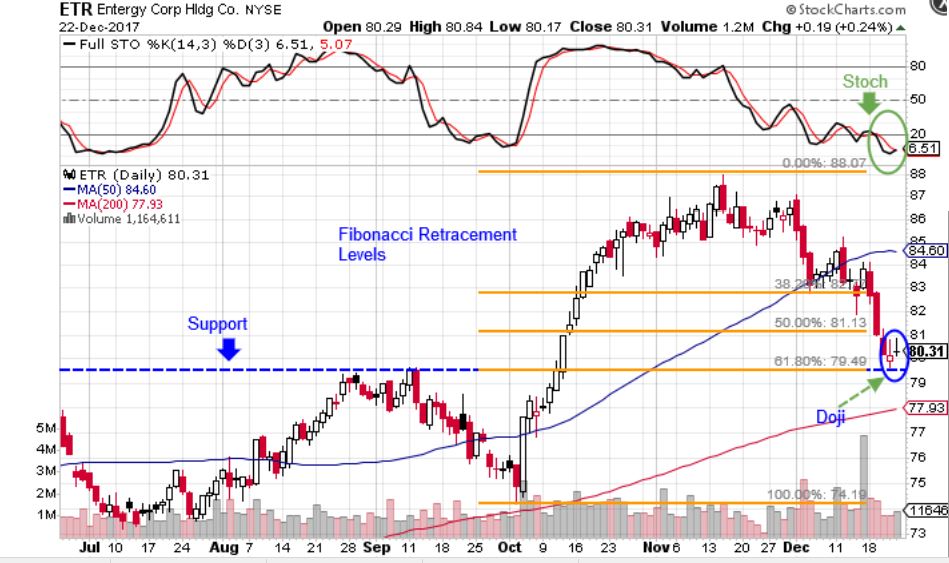
#3 Stochastic below 20: The Stochastic has crossed below 20, indicating that the stock is oversold. The black (%K) line of stochastic is also about to cross over the red (%D) line. This cross, when it happens, is called a signal line cross and is usually an indication of the reversal of the trend.
For ETR, such a cross had happened during the first week of October.
The stoch was below 20 and the single line cross had also occurred then.
As you can see from the chart, the stock rallied to a new high till mid-November.
Once when the black line crossed below the red line and the stoch value was above 80, the stock price started declining again and the trend was reversed.
#4 Doji: ETR’s last two daily candlesticks have been a Doji. This is a clear reversal candlestick pattern. The stock is poised for an upward move from here.
#5 Trading above 200 day SMA: ETR’s daily chart shows that the price is currently above the 200-Day SMA. This shows that the stock is still in an uptrend.
Recommended Trade
If you want to get in on this trade, you can purchase shares of ETR at the current level of $80.31. Alternatively, you can also wait until there is a pullback to $79.50. Either way, our target price is the top of the Fibonacci retracement, at $88.
Note: The stock has the potential to move even higher once this Fibonacci high level is broken. If the stoch is below 80 when the stock price reaches $88, you can hold onto at least 1/4th of the shares for a further upmove. Sell those shares once Stochastic is above 80 and the black line crosses below the red line.
To limit risk, place a stop loss below $79.40, which is below the support line.
Our target potential upside using the current price of $80.31 is 9.6% in the next 1-2 months.
For a risk of $ 0.91 per share, our reward is $7.69 per share, making this a 1:8 risk-reward trade. In other words, this trade offers 8x more potential upside than downside.
Risks to Consider
ETR may reverse its overall trend if it breaks down from the major support level of $79.50. The sell-off of the stock could also be triggered in case of any negative news, overall weakness in the market, or any regulatory changes in the sector.
[ad#mmpress]
