The “game of catch-up” just kicked into overdrive…
[ad#Google Adsense 336×280-IA]On July 11, the benchmark S&P 500 Index broke out to an all-time high.
That day, I showed my DailyWealth Trader subscribers that after the S&P 500 hits its first all-time highs in at least a year, it nearly always (92% of the time) continues higher. And its average gains over the following 12 months are far larger than normal…
But while large companies were hitting new highs, the benchmark small-cap index – the Russell 2000 – was lagging. It was still nearly 9% away from its all-time high.
So a few days later, I told subscribers it was time for small stocks to play catch-up…
For most of the last year (the first seven months), stocks dropped across the board. And when stocks fall, “small cap” stocks (so called because they have small market capitalizations) usually fall more than large-cap stocks. They’re more volatile.
But when stocks rise, “more volatile” means small caps tend to rise more than large caps, too.
The idea was simple. If large caps rise more than normal after hitting new highs, small caps would likely rise even more. The Russell 2000 would likely hit a new all-time high, too.
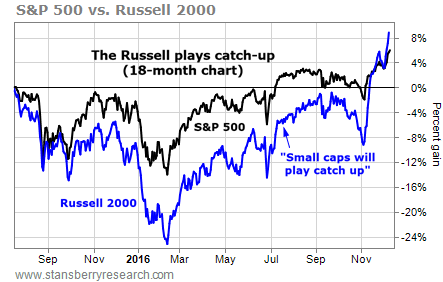
The chart below is an updated version of one I shared with my subscribers back in July. Back then, it showed that over the prior year, the Russell 2000 was underperforming the S&P 500 by more than seven percentage points. (The Russell 2000 was down more than 5%, and the S&P 500 was up more than 2%.)
Now, it shows that the game of catch-up is complete. The Russell 2000 broke out to a new all-time high last month… And it’s now showing bigger gains than the S&P 500, since July 2015.
That’s a fantastic outperformance… It’s a great five-month gain… And there’s likely more to come.
As I said above, the S&P 500 tends to generate big returns in the year following new all-time highs. The table below shows the index’s average returns for different time frames, using prices from the last 75 years (through July 2016).
The first row only includes the 13 times the S&P 500 hit a new all-time high after pausing for at least a year. The second row includes all (one-month, two-month, three-month, etc.) periods over the past 75 years.
If it weren’t so rare, you would probably want to own stocks only after they hit these new all-time highs…

As you can see, the S&P 500’s average gain one year later was 14%. Now, about five months in, the index is just 5.7% above its old (May 2015) all-time high. It’s right in line with its “new high” average.
If the market continues along this path, the S&P 500 will rise another 7.9% over the next seven months. And small-cap stocks will likely rise even more.
As you know, nothing is guaranteed in the market. The future doesn’t always play out like the past. But it often does. New all-time highs usually lead to even higher prices. And when large stocks rise, small stocks usually rise faster. That’s exactly what we’re seeing now.
Good trading,
Ben Morris
[ad#stansberry-ps]
Source: Growth Stock Wire
