
A dangerous pattern is developing right now.
And it could lead to a quick, 3% drop in the broad stock market.
Let me explain…
First, let’s take a look at this chart of the S&P 500…
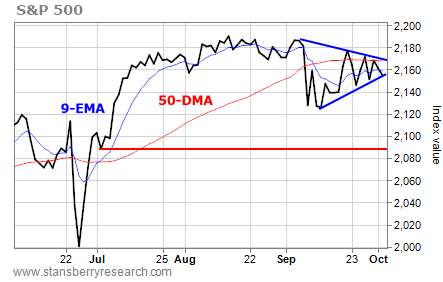
This is a consolidating-triangle pattern with lower highs and higher lows. The chart is approaching the apex of the triangle.
[ad#Google Adsense 336×280-IA]Meanwhile, the nine-day exponential moving average (EMA) crossed below the 50-day moving average (DMA) three weeks ago.
This “bearish cross” often signals the start of an intermediate-term correction phase.
Since this triangle started forming off that large move down in early September, we have to give the benefit of the doubt to the bears.
Triangles often break in the direction in which they were formed. So the odds favor a breakdown.
Plus, we have bearish seasonality here as well. Stocks tend to perform poorly in early October.
So now is not a time to aggressively buy stocks. Rather, it’s a time to be cautious.
If the S&P 500 breaks below the support line of the triangle at about 2,155, we’ll likely get a quick move down to 2,125 or so. If the selling gets nasty, the S&P 500 could test the 2,090 support level. At that point, the index would be far enough below its 50-DMA to set the stage for a year-end rally in stock prices.
But we’ll deal with that if we get there. For now, it’s best to look for ways to profit if the stock market breaks down from here.
There is room inside the triangle for another move higher toward 2,170. That would be a low-risk area at which to add some short exposure. Aggressive traders can short the index near 2,170 and keep a tight stop on the trade at about 2,180. That will limit your potential loss to just 10 points if the market keeps moving higher.
Otherwise, if the market breaks down from here, the S&P 500 could easily lose 40 or 50 points.
Best regards and good trading,
Jeff Clark
[ad#stansberry-ps]
Source: Growth Stock Wire
