A crucial indicator is telling us our favorite precious metals are ready to explode higher.
And it underscores why silver must make up a small – but critical – part of your portfolio.
[ad#Google Adsense 336×280-IA]This indicator has held true throughout history. And right now, it’s showing that it’s time to buy silver again… and that silver stocks could see even bigger gains.
Let me explain…
First, you should understand that silver acts like gold’s volatile shadow.
Whatever direction gold moves in, silver tends to follow… but its price action is much more extreme. When investors hate gold, they loathe silver. And when they’re desperate for gold, they buy up silver even faster.
For example… in a little more than three years, from August 1976 to January 1980, gold soared 700% to $850 an ounce. But silver soared an incredible 1,100% over the same period. And the pattern has repeated for more than four decades… Silver has outperformed its more expensive cousin in each of the six bull markets of the past 40 years.
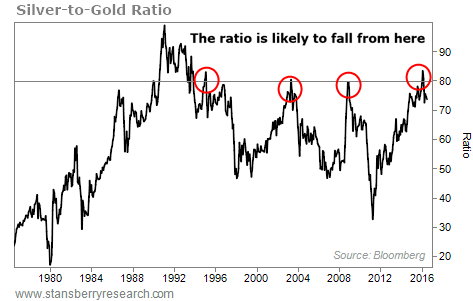
You can see this clearly in the silver-to-gold ratio. This indicator is simply a measure of how many ounces of silver you can buy with one ounce of gold. It’s a rough guide that shows how cheap or expensive one metal is relative to the other. When the ratio is low, gold is relatively cheap. When the ratio is high, silver is relatively cheap.
Over the past 40 or so years, the ratio has averaged around 60:1… meaning you needed 60 ounces of silver to match the value of an ounce of gold.
Today, the ratio is 74:1. That means you need about 14 more ounces of silver to buy an ounce of gold than you would have needed, on average, over the past 40 years.
Like with most indicators, extremes in the silver-to-gold ratio present the best opportunities for us to profit.
For example, when both gold and silver sold off in 2008, the ratio jumped to more than 80:1. In other words, when people were selling gold, they were dumping their silver even faster. (The ratio hit as high as 83:1 again this past February.)
Then, as both metals rallied, the ratio narrowed to just more than 30:1 in April 2011. People were bidding up silver even faster than gold. Gold climbed more than 160% during that period. But silver soared by more than double that – 359%.
In both cases, silver crushed gold.
Silver outperforms gold in a bull market as investors pour in. But likewise, it underperforms gold dramatically in a bear market as investors dump silver faster than gold.
In the chart below, we’ve plotted the silver-to-gold ratio for the past 30 years. You can see that the ratio typically peaks around 80:1 when a bear market in precious metals is at its worst. The ratio has now dipped to about 74:1, which is why we believe we are in the early stages of the next bull market…
That’s why we think silver is ready to explode again…
Silver’s moves tend to lag gold. So when gold makes a move, it sometimes takes a little time before silver follows. But when it does… it can skyrocket.
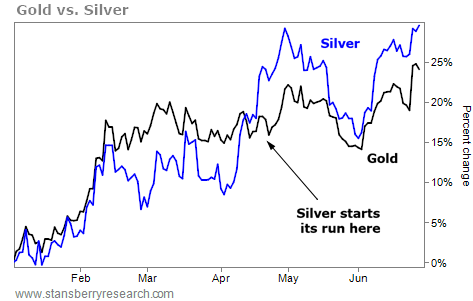
During the first quarter of this year, gold climbed 16%. Silver was up, too, but only by 9%. So even though silver stocks soared along with gold stocks in the first quarter, the underlying metal still trailed gold.
Now, fast-forward to today.
Silver just picked up the pace. Through Friday’s close, silver is now up almost 30% versus gold’s 25% return. Both are great returns. But if history is any indication of where silver might be heading, it’s time to buy silver stocks again.
Since both metals last peaked in 2011, silver has lagged gold. In that span, gold is down about 30%, while silver has fallen 58%.
Recent data suggest that the ratio is starting to narrow… It’s another sign that the five-year bear market in gold and silver is over.
When silver takes off, it can soar. And silver stocks can soar even more. This powerful historical trend is coming around… and now is the perfect time to take advantage.
Regards,
Porter Stansberry
[ad#stansberry-ps]
Source: Daily Wealth
