
Copper is gearing up for a rally.
We last discussed copper in Growth Stock Wire last November. Back then, the metal traded for about $2.10 per pound. And the chart looked bearish.
I told readers to avoid the temptation of buying the beaten-down metal. As I wrote…
The best the copper bulls can hope for is a period of consolidation – where the price of copper chops back and forth in a tight trading range for several weeks. The worst case is a move all the way down to the support line of the 2009 low.
As it turned out, the “best” situation happened. Copper has been consolidating in a relatively tight trading range for the past seven months.
Now, while copper is still trading for about $2.10 per pound, the chart is turning bullish…
Let’s take a look…
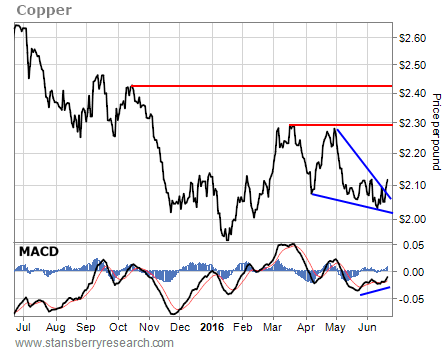
The blue lines on the chart show a bullish falling-wedge pattern. And as you can see, there’s positive divergence on the moving average convergence divergence (MACD) momentum indicator.
[ad#Google Adsense 336×280-IA]In other words, as the price of copper fell earlier this month, the momentum behind the move improved. This sort of positive divergence is often an early warning sign of a potential reversal in the current trend.
Copper broke out to the upside of the pattern earlier this week. The next obvious resistance level is all the way up at $2.28. That’s 7% above Tuesday’s closing price.
And if the rally really gains momentum, copper could run higher over the next several weeks.
It could possibly reach last October’s high of about $2.45. That would be a 15% gain from Tuesday’s closing price.
Charts that break out from falling-wedge patterns often come back down and retest the former resistance line of the wedge as support. So copper now has support at about $2.06 per pound.
Traders should use any pullback toward that level over the next few days as a chance to buy into this metal.
Copper looks ready to move higher. Any pullback from here is a buying opportunity.
Best regards and good trading,
Jeff Clark
[ad#stansberry-ps]
Source: Growth Stock Wire
