
If you’re like lots of folks, you’re taking a cautious approach to the stock market today…
The past year has been a tough time to hold stocks. The benchmark S&P 500 Index dropped more than 12%, twice.
Plus, lots of people are pessimistic about politics and the economy.
[ad#Google Adsense 336×280-IA]But stocks march to the beat of a different drum…
This week, the benchmark S&P 500 hit a seven-month high. And according to one important measure, the long-term uptrend has resumed.
As I’ll show you today, 50 years of history says that higher stock prices are extremely likely. So if you’re holding on tightly to your bearish outlook, this essay may help you loosen your grip… and profit in stocks over the next year.
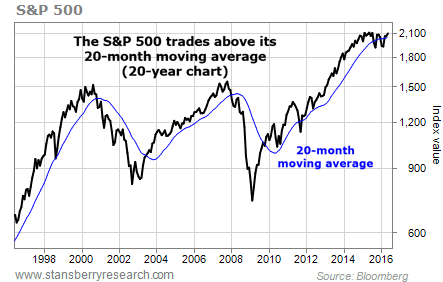
Today, we’re looking at a gauge called the 20-month moving average (MMA). It works by collecting an asset’s closing price on the last day of the month for the past 20 months, then taking the average of those prices. This produces a chart line that “smoothes out” market volatility.
The 20-year chart below shows the S&P 500’s monthly closing prices (the black line) along with its 20-MMA (the blue line). The index has been trading above its 20-MMA since March.
The black line has crossed above the blue line just 26 times over the past 50 years. And when it has, the returns that followed were surprising. Specifically, every single time it has happened, the S&P 500 was higher one year later. The average one-year return was 16.6%.
Even the shorter-term results were impressive. Stocks were higher three months and six months later 80% of the time… And the average returns after three months and six months were 4% and 7.9%, respectively. (Note: The number of occurrences isn’t 26 because the latest crossovers won’t have results until the future.)

Again, the latest crossover was at the end of March. The S&P 500 has now been trading above its 20-MMA for three months.
So is it too late to get in? No.
Here are the results for all the times that the S&P 500 closed above its 20-MMA for three consecutive months… looking three, six, and 12 months out.

After one year, the worst return was breakeven. The averages were all positive.
History doesn’t predict the future. But in this case, the results have been extremely consistent. A year from now, stocks will likely be higher.
If you’ve been holding a large amount of cash on the sidelines, now is the time to start buying stocks.
Good trading,
Ben Morris
[ad#stansberry-ps]
Source: Growth Stock Wire
